Atlas Of A Social Studies Teacher
  • Home
  • Technology Blog
  • Philosophy
  • Classroom Management Theory
  • Sample Lesson Plan and Materials
  • Example Assessments
  • Project Portal

Visuals = Student Understanding 

10/26/2012

4 Comments

 
Picture
65% of the population are visual learners and growing
The brain processes visual information 60,000 faster than text. 

- -- 90% of the information that comes to the brain is visual -- - 

40% of all nerve fibers connected to the brain are linked to the retina
Visual aids in the classroom improve learning by 400%  
- The Visual Teaching Alliance 
Picture


Studies show that only 30% of students are auditory learners, yet 80% of what is done in the classroom is auditory based. So how are the rest of the students learning during that 80% of time? 
The answer is they are most likely not. When students aren't learning or focused on a task they are more likely to cause disruptions, be distractors to students who are trying to learn and are prone to misbehavior. 


Picture

It is not only students that are becoming more visual, the world in which we live in is as well. Students are growing up in a time with 3D movies, television, video games, computers, smart phones, and the internet, etcetera. Recently there have been reports showing that students will spend an average of eight hours a day in front of a screen, be it the television, phone, or computer. The world is becoming a more visual place and the students who are growing up with it are as well. Old instructional methods will not reach the younger generations and it is now more important than ever that educators differentiate their instruction methods to include the 70% of the class they are currently leaving out. This means instructors need to become proficient visual teachers by providing students with visual stimulation accompanied by active learning strategies. By understanding and incorporating visual culture and technology into the classroom students will be better equipped for success in their future learning and more prepared for the society in which they will live and work.

Who is a Visual Learner ???
Visual Learner: Someone who learns best through seeing information. 
Characteristics of visual learners are as follows:
  • Information presented in pictures, charts, or diagrams is easily remembered.
  • Visual learners have strong visualization skills. They can look up (often up to the left) an "see" the information invisibly written or drawn.
  • Visual learners can make "movies in their minds" of information they are reading. Their movies are often vivid and detailed.
  • Visual-spatial skills such as sizes, shapes, textures, angles, and three-dimensional depths are strong.
  • Visual learners often pay close attention to the body language of others (facial expressions, eyes, stance, etc.)
  • Visual learners have a keen awareness of the aesthetics, the beauty of the physical environment, visual media, or art.
Picture


Examples of Instructional Tools to aid Visual Learners:
Click on the word to learn more information
 Word Clouds

Wordle
Tagxedo
Tagul 
Word It Out
Tag Crowd 
Wordsift
Make Word Mosiac
VocabGrabber 
TagCloudGenerator
You Are Your Words
txt2pic 


Graphic Organizers
 

Creately
 ChartGizmo
Webspiration
Bubbl.us
Online Chart Builder
Tableau Software
Many Eyes
Daytum
Gapminder
Touchgraph


Infographics


Piktochart
easellybeta
Good Labs
Infogram
Venngage
Visual.ly 
Datameer
Vizify


Visual Timelines


xTimeline
Dipity
Timetoast 
Office Timeline
Preceden
OurTimelines


Interactive Maps

Meograph
StatSilk
Google Public Data

For Ideas on using word clouds in the classroom here and for implementing infographics click here.

Above and below are some examples I have created using a couple of the tools above. The first example on top is of a word cloud made using Tagxedo. The image was inspired by an activity I did at a mini workshop put on by the Anti-Defamation League on resistance during WWII/The Holocaust. The second is an infographic that could be used in the classroom to teach about Netiquette. It was made using Infogram.

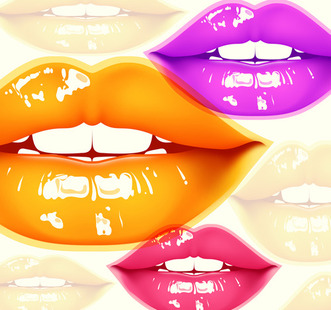
Some of the images at the beginning of this post are by illustrator, Autumn Whitehurst. 
4 Comments

    Tech. Seeker

    "The real problem is not whether machines think but whether men do." 
                         -B.F. Skinner 

    I believe in bringing technology into the classroom, it can be a  powerful learning tool and is a key factor in helping students develop 21st century skills.  Due to this I am always looking for new technology to incorporate into my lesson plans. This blog started out as a college class project and is becoming a way for me to explore, save and share my ideas about bringing technology into the classroom.  

    Archives

    June 2015
    February 2015
    September 2014
    April 2014
    December 2012
    November 2012
    October 2012
    September 2012

    Categories

    All
    21st Century Skills
    A. November Edu Talks
    API
    Apps For Education
    Constructivism
    Continuing Education
    Copyright
    Diigo
    Emerging Technology
    Epals
    ESL
    Etech
    Ethics
    Freerice.com
    Gaming In The Classroom
    Global Connections
    Google +
    Google Docs
    Graphic Organizers
    Infographic
    Inquiry Based Learning
    Instructional Strategy
    Interactive Maps
    Iste
    Kollaborate.io
    Learning Styles
    Lesson Ideas With Tech
    Meetings.io
    Netiquette
    Networking
    Paperrater.com
    Podcast
    Presentation.io
    Presentation Tech
    Prezi
    Professional Development
    Same.io
    Screencast-o-matic
    Search Engines
    SelfControl/ColdTurkey
    Tagxedo
    Teaching Resources
    Technology In Education
    Timelines
    Tweetdeck
    Twitter
    Video Chats
    Virtual Classrooms
    Visual
    Voki
    Web 2.0
    Webquests
    Wiki
    Word Cloud

    RSS Feed


Powered by
✕